


If you’re new to investing in the last decade, don’t get too comfortable. Achieving good investment returns has required little effort.
This period has made a straightforward investment strategy popular: “VOO and chill.” It’s easy enough to fit on a bumper sticker. You buy and hold a single index fund that tracks the market. If you followed this strategy, you would have averaged a 15% gain per year. Compare this to the long-term market average of 10%. It may sound like a minor difference, but the compounding over time is what makes it add up. It’s the difference between $1,000 growing to roughly $2,600 vs. $1,000 growing to roughly $4,200.
Growth Driven by a Select Few
The abnormal returns came from a small group of American tech companies. These are Apple, Microsoft, Alphabet, Amazon, Nvidia, Meta, and Tesla. In 2015, these seven made up about 12% of the S&P 500, with a combined market value of around $2.2 trillion. Today, their combined value exceeds $22 trillion, which is roughly a tenfold increase. They account for about a third of the entire index.
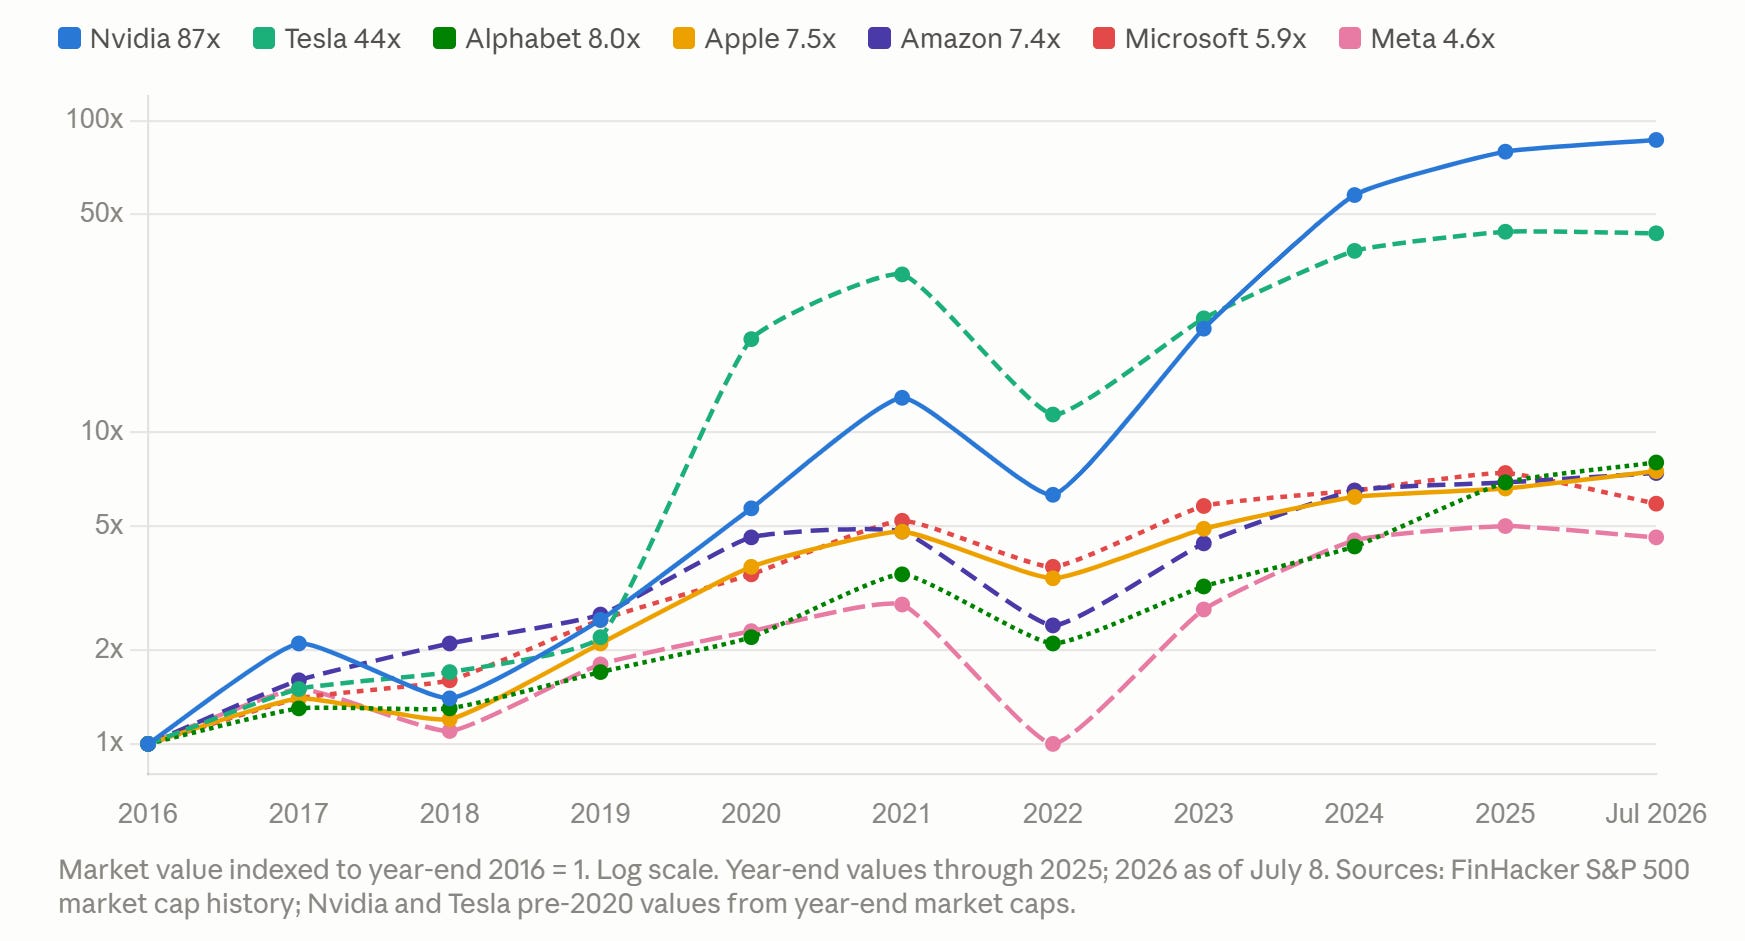
The chart needs a log scale to fit on one axis. Nvidia grew around 87 times, and Tesla about 44 times. The slower members still grew five to eight times.
Companies rise and fall. That’s the natural life cycle of business. But consider how rare these seven businesses are. The scale of these businesses is without precedent. The companies at the top of today’s market report record annual profits. These profits are the largest ever seen by any public company.
The other 493 companies of the S&P 500 grew at a historically normal rate during this period, roughly 9% per year. The whole abnormality revolves around seven names. The wealth created by the VOO and chill crowd depends on them.
Prices Increased
The other factor that drove abnormal returns was multiple expansion. Investors now pay more for each dollar of earnings than before.
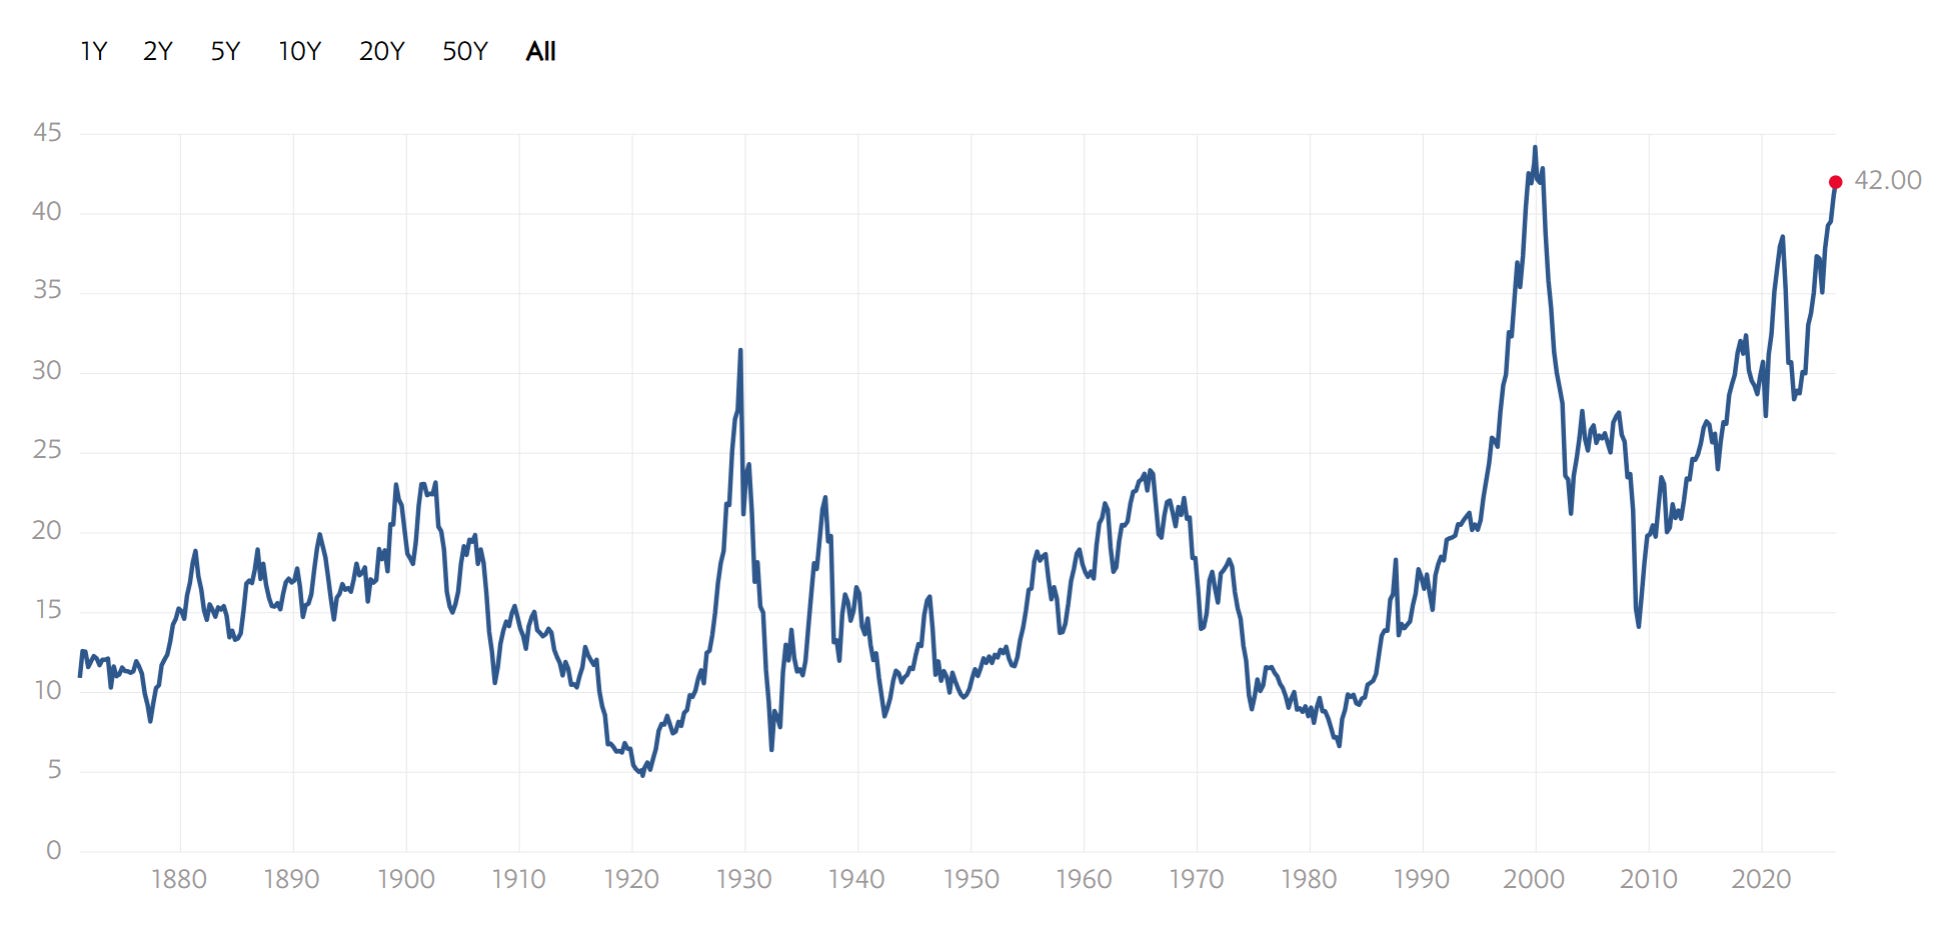
The Shiller CAPE index compares market prices to inflation-adjusted earnings. Since 1881, its long-run average has been 17x. Today, the reading is 42x. Investors are now paying about 2.4 times the usual amount for each dollar of earnings. In 145 years of data, only December 1999 showed a higher rate. That was months before the index dropped by nearly half.
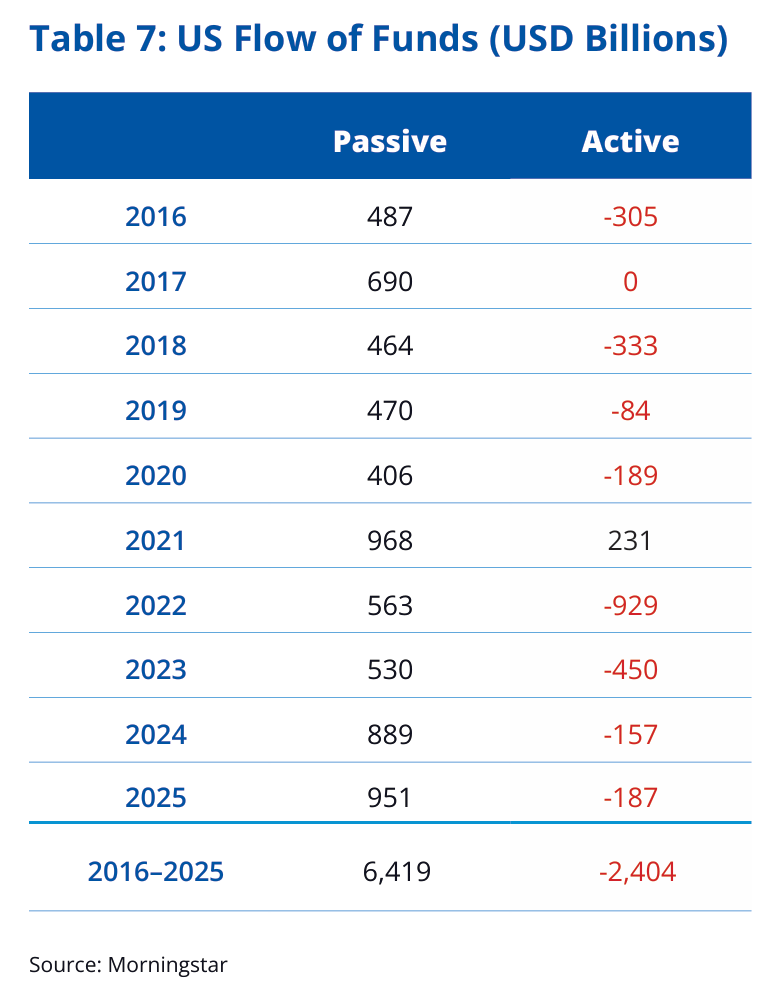
Part of what pushed prices up is the supply of money flowing into the stock market itself. Between 2016 and 2025, passive funds in the U.S. took in $6.4 trillion of new money while active funds bled out $2.4 trillion. In total, about $4 trillion of new capital flowed into the market over the decade. This reflects both a rotation and an expansion. This shift increased index funds’ share of equity fund assets from 36% to 57%. This affects prices because passive capital doesn’t care about value. It doesn’t ask if Nvidia is cheap; it just buys what the index includes, regardless of what the price is.
Some of the price expansion is fair. In the 1930s, the stock market was railroads, steel mills, and other capital-intensive industrials. The stock market today is higher quality. It consists of scalable software platforms with high profit margins. A dollar of software earnings deserves a higher price than a dollar of railroad earnings.
How much more could multiples realistically expand from here? By any historical measure, almost none. At 42x, the CAPE has been exceeded only once, right before a massive crash. Goldman Sachs predicts the S&P 500’s forward multiple will drop from 23x to 21x by 2035. They expect the U.S. stock market to return 6.5% a year. This is much lower than the 15% annual returns seen over the last decade.
Keep in mind, the CAPE has sat above its long-run mean almost continuously since 1991. Anyone who acted on the belief it’s overpriced would have missed the best thirty-year run in market history.
International Stocks Sat This One Out
Over the last decade, international stocks significantly underdelivered relative to the gain of U.S. stocks. The valuation gap that opened up along the way is now the widest on record. The S&P 500 trades around 21.5x forward earnings, non-U.S. stocks trade near 15.5x, and emerging markets sit at 13x.
Cross-country CAPE comparisons are not always reliable. Different accounting, different sector mixes, different governance, and cheap markets are frequently cheap for excellent reasons.
The explanation for this gap is primarily sector composition. International markets did not enjoy the AI boom the way the U.S. did. A J.P. Morgan analysis found that since ChatGPT launched in November 2022, AI stocks accounted for 75% of the S&P 500’s returns. They also contributed to 80% of the earnings growth. Taiwan’s chip fabs and Korea’s memory makers were unique cases positioned to benefit from this boom.